Forecasting with Quantile Grids (2015)

Quantile Grids represent a radical improvement over classical forecasting methods whenever inventory is involved. They are also superior to quantile forecasts because they deliver much more information about the future. Traditional forecasting methods work poorly, especially for commerce. The root cause of this problem is simple: the future is uncertain. Classic forecasts try to predict the one correct value of future demand, and, well, they fail at it. Desperately trying to fix classic forecasts in the hope that the “correct” future demand will be predicted is delusional. Quantile grids take a completely different stance on this issue.
With quantile grids, Lokad predicts not one future demand value for a given product, but the entire probability distribution for the demand; that is the probability of having a demand of zero units, then one unit, then two units, etc. This information is vastly richer and can be leveraged in ways that are exceedingly more profitable than classic forecasts.
Introduction for the non-statistician
As you are reading these lines, if you are not a statistician, you might wonder if your business has any chance at succeeding in doing anything sensible with these so-called “quantile grids”. This sounds more like a good title for a PhD thesis is modern statistics rather than a practical means of forecasting. Well, if you think that this term is intimidating, just mentally replace quantile grids by forecasts that actually work, and this will do. The vast majority of companies who use Lokad have zero skills in statistics. The spam filter associated with your inbox is also using advanced statistics, and it does not take a PhD to use an inbox.
Lokad is doing roughly the same for commerce. We are leveraging advanced machine learning to make your company more profitable, and the technology behind it is now so advanced that you actually do not have to care very much about it anymore.
Below, we describe what goes on behind the scenes at Lokad, but rest assured that you can use Lokad even if you do not have a full understanding of what goes into our forecasting engine – much like you can use a spam filter without being familiar with Bayesian probabilistic inference.
Re-thinking forecasting for commerce

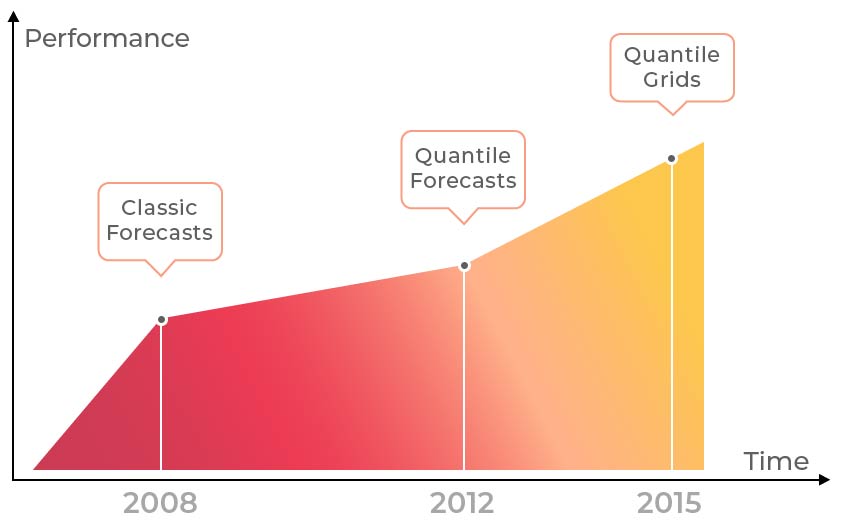
Keep in mind that 1000 hours of computing power costs less than $50 when using a cloud computing platform. Obviously, this opens up radically new perspectives for forecasting, and it is exactly these perspectives that Lokad has been exploring extensively. Quantile Grids represent the third version of Lokad’s forecasting technology, but let’s go a few years back to get the full picture. We started with classic forecasts in 2008 as the first version of our forecasting technology, and despite three years of tremendous R&D efforts on the part of Lokad’s team, the classic approach proved to be a dead end. We never really did succeed in having any client deeply satisfied with classic forecasts. As we learned more about our clients’ experiences with other forecasting vendors, it turned out that there was not a single company that was even close to being satisfied with the forecasting technology they had acquired. This problem was not specific to Lokad, and we realized that the entire forecasting industry was dysfunctional; and we decided to do something about it.
In 2012, Lokad released the second version of its forecasting technology codenamed Quantile Forecasts. Simply put, quantile forecasts address the No1 issue that plagues classic forecasts: classic forecasts simply do not look at the right problem.
Indeed, the challenge for companies is to avoid two extremes: unexpectedly high demand that causes stock-outs, and unexpectedly low demand that causes dead inventory. What happens in the middle when the future demand is roughly “as expected” matters very little from the business perspective.
Yet classic forecasts, mean or median forecasts, completely ignore these “extreme” situations and focus entirely on the average case. Unsurprisingly, classic forecasts fail at preventing both stock-outs and dead inventory. Quantile forecasts approach the challenge heads-on and directly look at the scenario of interest, say avoiding stock-outs, and strive to provide a precise answer to this very problem. Suddenly in 2012, we started having more and more satisfied clients. For the first time in the history of Lokad, more than 3 years after the company’s launch, we had something that worked.
In 2015, Lokad released the third version of its forecasting technology, the quantile grids. While quantile forecasts were already a radical improvement over classic forecasts, they still had their weaknesses. As we gained more and more experience with dozens of deployments of our quantile forecasting technology, we realized that while the idea of producing a forecast for just “one” business scenario was sound, it was not entirely complete. Why just this one scenario ? Why not a second scenario, or a third ? Manually managing multiple scenarios proved tedious, and we realized that all scenarios should be forecasted at once. From a computing perspective, this was significantly more costly: for every product, we would compute the respective probabilities of (almost) every single demand level. However, while the amount of computations involved appears staggering, the prices of computing resources have also been in free fall over the years. And what we would have considered to be too costly 5 years ago, was now very much affordable. In 2015, Lokad released the third version of its forecasting technology, the quantile grids. While being extremely computationally intensive, quantile grids are now affordable thanks to the free fall drop of cloud computing resources.
Taking the entire probability distribution of demand

The system can potentially be fine-tuned a little to produce slightly more probable values for future demand, but that’s about it. Your company ends up getting only slightly more probable values for future demand, which does not result in a boost of business activity that would have been expected in the first place.
Quantile Grids take a very different approach: for every product, Lokad calculates the respective probabilities of every single level of future demand. Instead of trying to maintain the illusion that future demand is known, quantile grids directly express the probabilities associated with many possible futures.
For example, if we consider an infrequently sold product with a lead time of 2 weeks, the distribution of demand over the next 2 weeks (usually the forecasting horizon has to match the lead time) for this product can be represented as follows:
| Demand | Probability |
|---|---|
| 0 unit | 55% |
| 1 unit | 20% |
| 2 units | 14% |
| 3 units | 7% |
| 4 units | 3% |
| 5 units | 0% (rounded) |
Thinking about the future from a completely probabilistic perspective might seem complicated, but it actually represents what every business executive is already doing, albeit in less formal ways: weighing the odds of certain outcomes and hedging the bets vis-à-vis their business in order to be well-prepared when dealing with the most relevant scenarios. From the forecasting engine perspective, since we do not know in advance what the “most relevant” scenarios would be, the logical solution, albeit a somewhat brutal one, consists of processing all possible scenarios. However, assuming that a business has one thousand products to forecast (and some of our clients have millions of SKUs to deal with), and that Lokad computes the probabilities associated with 100 scenarios for each product, the quantile grids would produce a huge listing with 100,000 entries which does not sound practical to process. We get to this point in the section below.
Prioritizing supply chain decisions
For every purchase decision, we can write down a simple back-of-the-envelope calculation, the “outcome” formula that depends on the future demand vs the current purchase decision. Then, every single decision can be scored because based on the respective probability of every level of future demand.

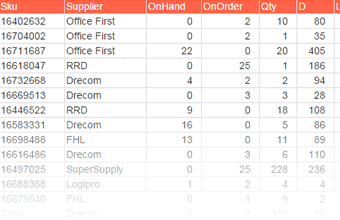
Once every decision has been scored, it is possible to rank all these decisions, putting the most profitable options at the top of the list. We refer to this list as the master purchase priority list. It is a list where every product appears on numerous lines. Indeed, while purchasing 1 unit of product Z might be the top-ranked purchase decision (a.k.a. the most pressing purchase), buying the next 1 unit of product Z may only be the 20th most pressing purchase decision, with many other units of other products to be purchased in between.

Better than tweaking service levels
Figuring out the “optimal” service levels that is the desired probabilities of not getting a stock-out, is a very difficult exercise. This is a complex issue because service levels are only indirectly related to the financial performance of a company. In fact, for some products, obtaining one extra percent of service level can prove to be vastly expensive, and hence, if resources are readily available, they should rather be allocated on other products, where the same level of investment would yield not 1% but an extra 10% of service level.
With Quantile Grids used as a master purchase priority list, one does not even need to care about service levels as these are natively reflected in the prioritization itself.
If the service level of a high-margin product can be cheaply increased, this product naturally climbs up to the top of the list. Inversely, if a product is suffering from wildly erratic sales which renders all attempts at increasing the service level extremely costly, then this product will rise to the top of the list only when stocks are running dangerously low and when a company is almost guaranteed not to end up with dead inventory despite very erratic demand patterns. The priority list also solves the problem of cash constraints. No matter where your company stands as far cash is concerned, the priority list gives you a tractable option. If you have very little cash available, your company only buys what is at the very top of the list, maintaining the stock levels of only those products that desperately need to be replenished. If you have additional cash on hand, your company then has the option of increasing its inventory by focusing on items that will drive the most growth while keeping inventory risks under control.
Injecting the supply chain constraints
Companies must frequently deal with supply constraints such as minimum order quantities either at the SKU level or at the order level. Sometimes, units need to be gathered in large batches such as containers. Such constraints can be naturally integrated into one’s workflow processes via a master purchase priority list as described above; not only does this provide prioritized purchase suggestions, but it also provides recommendations that are compatible with one’s ordering constraints.
The exact process to follow depends on the actual type of constraints a business may have. Let’s consider container shipments for example. Lokad can compute the cumulative volumes per supplier, assuming that purchase lines are processed in the order of the list and assuming that each supplier is shipping independently from the other. Based on these cumulative volumes, the process of going down the list until the target container capacity is reached is very straightforward. Similarly, if a minimum order quantity constraint exists for a given SKU, in this case it is also easy to remove from the list all the lines that come before the constraint is fulfilled and to report the quantities directly to the first line once the constraint is satisfied.
