Overfitting: when accuracy measure goes wrong
As we already said, the whole point of forecasting is to build models that are accurate on the data you don’t have. Yet, at first glance, this looks like yet another crazy mathematician idea: both weird and utterly unpractical.
But in our experience, measuring the real forecast accuracy is a real business problem. Failing at this costs money. Actually, the larger the company, the larger the cost.
Still clueless about the real forecast error?
Check out our latest 9min slidecast (scripts are pasted below).
Slidecast scripts:
Overfitting: your forecasts may not be as good as the measure tells you
Forecasting accuracy is critical for many industries such as retail, manufacturing or services. If you over-forecast your customer demand, your costs explode because you will have too much staff, too much inventory. But if you under-forecast your customer demand, your customers get angry because they can’t buy your product or because they have to wait for too long to get served.
In this slidecast, I am going to introduce a little known problem in forecasting called overfitting.
This problem is little known for two reasons. First, it’s a subtle problem - non-obvious and counter-intuitive in many aspects. Second, it’s a problem that has been puzzling mathematicians since the 19th century. It’s only at the end of the nineties, a little more than 10 years ago, that the scientific community started to really comprehend this problem both at the theoretical level but also at the practical level.
Before getting any further, let me jump to the conclusion. Overfitting has a very strong impact on your forecasts. Overfitting can make you believe that you have a 10% forecast error while your real forecast error is 20%, and that would not be a worse case situation.
Overfitting is a very real business problem. Overfitting costs money.
Moreover, there is no work-around for overfitting. Modern statistical theories are built on top of this very concept. Overfitting plays a central part in those theories, no matter which way you approach statistics, overfitting is here to stay.
The key problem is to define what forecasting accuracy actually means.
Intuitively, the easiest way to measure the forecasting accuracy consists in making a forecast and waiting for the forecasted event to happen; so that we can compare the forecast with its corresponding outcome.
Yet, this method has a big drawback: it only tells you about the accuracy of past forecasts. From a business perspective, it matters little to know that past forecasts were good or bad, since you can’t change them anyway. What really matters is to make sure that forecasts that are yet to come are truly accurate.
Then, there is another problem: unless the method used to produce the forecasts is strictly identical from one forecast to the next, there is no reason to even believe that past accuracy could be used as a reliable indicator for future accuracy.
Since the 18th century, mathematicians have introduced the notion of statistical model. The primary aspect of statistical models is not, despite popular belief, to provide good or bad forecasts, but to provide repeatable forecasts.
With a statistical model, you get a process that automates the production of forecasts. It does not guarantee that forecasts will be good, but at least if, forecasts are poor, you can analyze the model further.
Let’s consider the following sample time-series. We will illustrate the overfitting problem by considering successive statistical models.
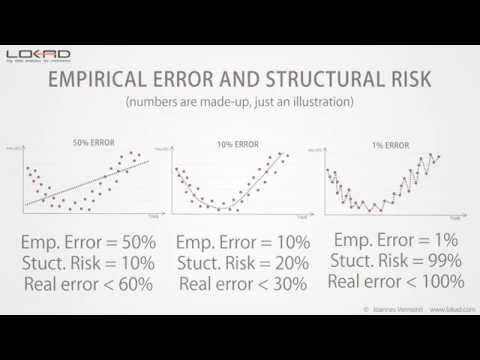
Let’s start with a simple linear model. As you can see, the line isn’t really well fitting the points of the time-series. As a result, we have a large error, over 50%. This model does not really fit the data.
Then, we can increase the complexity of the model. We have now a model that follows roughly what looks like the local time-series average. This new model looks much better than the previous one, and indeed the error has been divided by 5, now reaching 10%.
We have a good model here, but can we still reduce the error further? Well, the answer is simple: yes, we can produce a model that achieves less than 1% error.
As you can see, it’s rather easy; we just have to design a model that goes through nearly all the points of the time-series.
But can we really trust this model to be 1% accurate on future forecasts? Obviously, we can’t! This model is just micro-optimizing tiny fluctuations of the past that are nothing but random variations. Intuitively, we can’t forecast true randomness; we can only forecast patterns such trend, seasonality, etc.
Now, if we compare the last two models, we have an obvious problem: according to our error measure, the model on the right - the one with 1% error - is ten times better than the model on the left.
Although it is obvious that the best model is one the left. This model is smoothing the random fluctuations of the time-series.
Thus, there is something wrong with the way we are measuring the error. This error, as illustrated in the previous graphics, is known as the empirical error. It’s the error that you get through measures on your historical data.
Yet, what we are really interested in is known as the real error. The real error is defined as the error of your forecasting model on the data you don’t have, that is to say: future data.
Although, this definition looks like a complete paradox: how can you measure anything if, precisely, you don’t have the data!
Since the 19th century, statisticians have been looking at this problem through an approach known as the bias-variance tradeoff.
If we look at the three models that we have, we can say that the linear model has a high bias: no matter which linear model we choose, it won’t ever succeed to really fit the data, unless, of course, if the data itself is linearly distributed; but in most situations, the linear model will just approximate the data distribution.
Then, the linear model has a low variance: intuitively, adding or removing one point in the time-series isn’t going to much affect the resulting model. This model is fairly stable.
At the other extreme, the model on the right has a very low bias: it fits, overfits actually, most of the points of the time-series. Yet, the variance is very high: adding or removing a single point is likely to cause major changes in this model. There is no stability at all.
In the center, we have a model that balances both bias and variance; and this looks exactly the way to go.
Yet, the main issue with the bias versus variance approach is that we still have no clue about what is really happening with the real error, that is to say, the error on the data we don’t have.
This tradeoff is frequently more a heuristic than a true statistical criterion.
Since the late nineties, the field of statistical learning, a broader theory that encompasses statistical forecasting, has made a significant breakthrough both at the theoretical and practical levels.
This theory is complex, but a simple equation gives us major insights in the results. This theory tells us that the real error is upper bounded by the sum of the empirical error and another value called the structural risk.
As we have seen previously, the empirical error is just the error measured on the historical data.
The structural risk is a theoretical criterion that can be explicitly computed for certain classes of models, and estimated for most of the other classes.
Back on our initial example, we can see that the structural risk increases with the model complexity.
Now if we quantify those structural risks, it gives us the following outlook.
We still do know the real error - that value can’t be measured directly anyway - but we see that the model of the center has the lowest upper bound on the real error.
The statistical learning theory does not give us the value of the real error, but it gives us instead an upper bound; and the whole point is to choose the model that achieves the lowest upper bound.
This upper bound acts as a maximal value for the real error.
Compared to the bias-variance tradeoff, we see that the statistical learning theory gives us a quantitative estimate of the real error.
The structural risk is difficult to estimate in practice. Yet, at this time, it’s still the best known solution to avoid overfitting.
We have seen previously that an obvious way of ending up with overfitting problems was to increase the model complexity.
But there is also another way, a more subtle way, of ending up with overfitting problems: this can happen by increasing the complexity of the data.
Adding extra points to the data typically reduces overfitting problems, but if you start adding extra dimensions to the data, then, you are likely to end-up with overfitting problems even if the models themselves stay unchanged.
In our experience at Lokad, this situation is frequently encountered by organizations that refine, year after year, their own forecasting models with ever increasing data inputs; without explicitly taking care of the structural risk that lurks within their models.
In high dimensions, even linear models are subject to overfitting problems.
This concludes this short presentation about overfitting. If you have to remember one thing, remember that without taking into account the structural risk, your measure of the forecast error is likely to be highly deceptive; and the bigger your company, the more money, it will cost you.
Thanks you very for interest. We will happy to address your questions in our forums.
Reader Comments (9)
Interesting slide show
Mark (3 year ago)
Wow what a great video, thank you for helping me understand overfiting.
Melford McRae (4 years ago)
BTW, I have tried viewing the slideshow on several browsers and I have not been able to view it. It never seems to load. Can someone at Lokad check it out and see what the issue might be?
Shaun Snapp (4 years ago)
I have just posted a refreshed video that works.
Joannes Vermorel (4 years ago)
It seems that SlideShare did not maintain their stuff over the years :-( Here are the audio file https://media.lokad.com/videos/2009-04-21-overfitting/overfitting.mp3 and the PowerPoint file https://media.lokad.com/videos/2009-04-21-overfitting/overfitting.pptx I will remerge those two as a YouTube video.
Joannes Vermorel (4 years ago)
This is quite a thorny problem. There is no other way to measure a forecast model but by checking against its historical performance, but the tendency exists to overfit to get “the best accuracy.” This all would be a bigger problem if a higher percentage of companies actually used their best fit procedure in the forecasting systems they purchased or really tuned the models. I would be interested in a discussion on how to prevent overfitting when using a best fit procedure.
Shaun Snapp (4 years ago)
I posted a follow-up answer at https://blog.lokad.com/journal/2014/5/20/how-to-mitigate-overfitting-when-forecasting-demand Hope it helps!
Joannes Vermorel (4 years ago)
Thanks for the slideshow. It helped me to understand overfitting, without going into the mathematical details.
Shyam Prasad Murarka (8 years ago)
Thank you for the slide show.
Abhishek (8 years ago)
