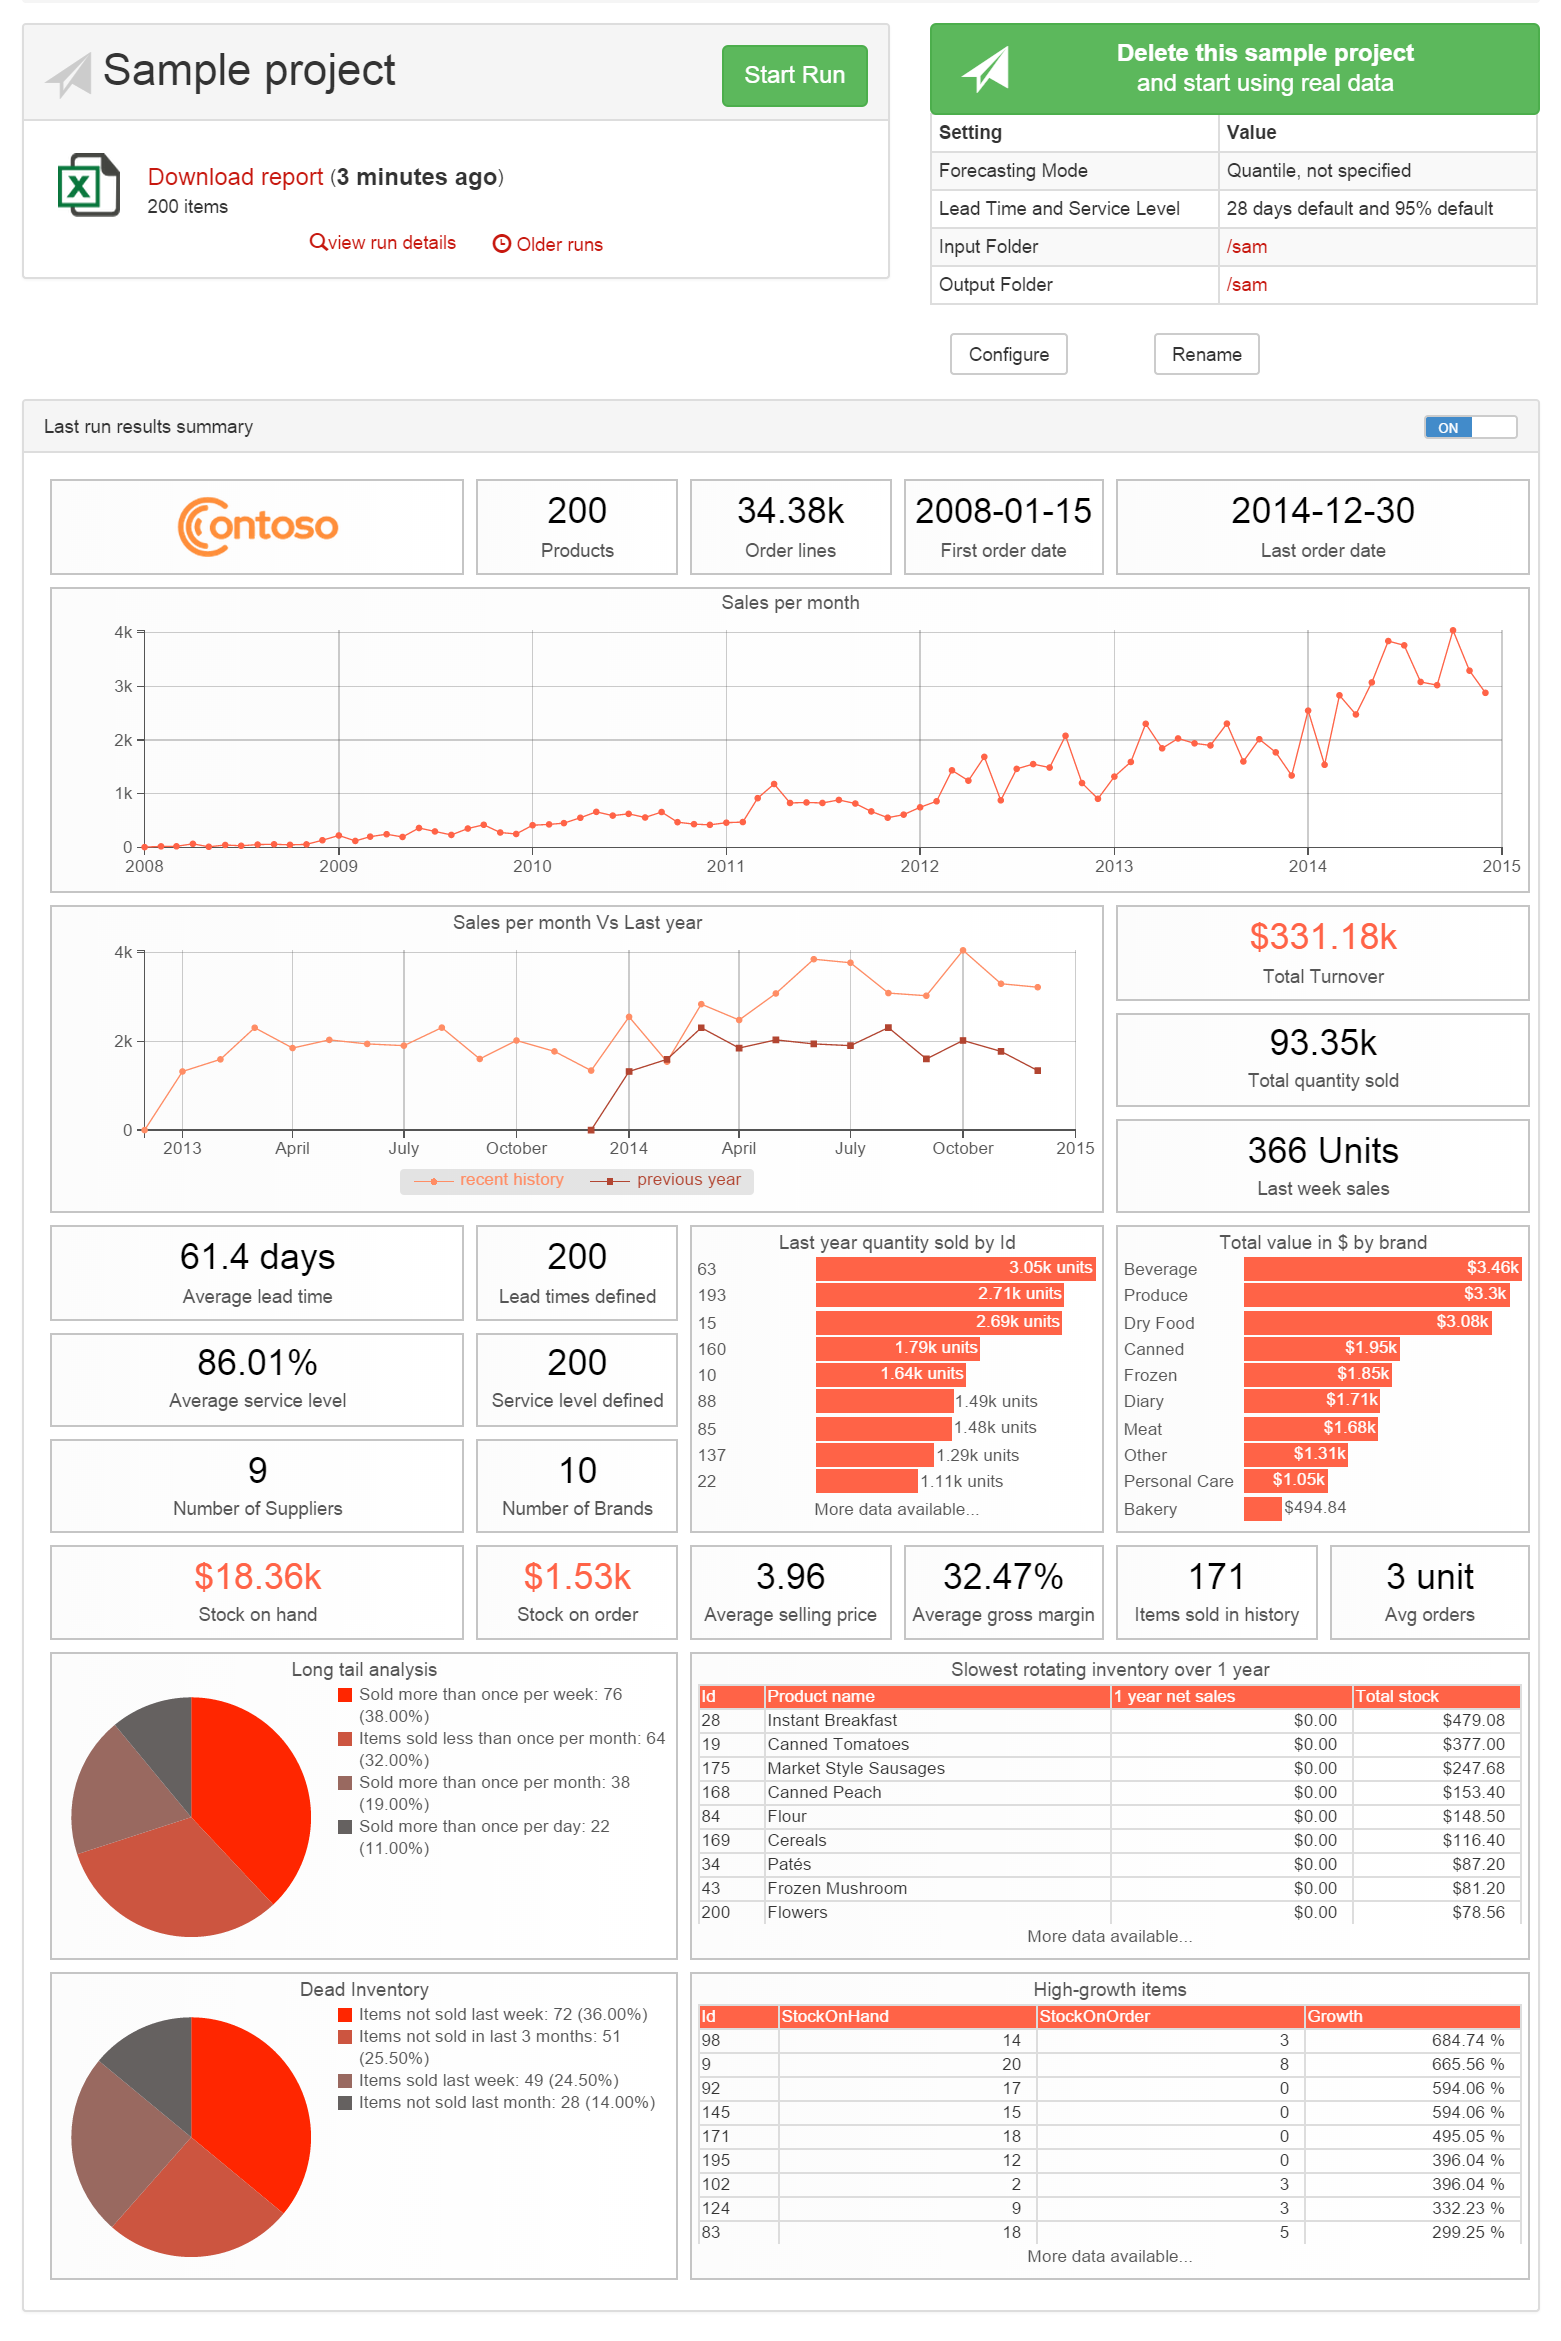
Built-in dashboards for Salescast

For years, Salescast has been delivering the best demand forecasts we could compute, but from the user experience angle, Salescast was plain, very plain. For every product or SKU, you would get the reorder point and the reorder quantity; and that was it.
Over the last couple of months, we have been steadily developing new ways to have our apps working better together, and today, we are happy to announce that Salescast now delivers built-in dashboards. For third-party apps that we natively integrate like Brightpearl, Linnworks and TradeGecko, those dashboards have been tailored to take advantage of the exact scope of data that Lokad is capable to import.
Under the hood, those dashboards are writtin in Envision, our data visualization & data processing script and executed by Priceforge. Through those templates, you can get a sense of what Envision is capable of. Those dashboards are fully customizable: it’s possible to add tiles or resize them, to create new tables or new linecharts.
Those dashboards are not just for data visualization however; it’s possible to use Envision to generate complex tables to be re-imported into other apps. For example, it’s possible to implement an advance reordering strategy on top of the results delivered by Salescast. In this scenario, the reorder quantities proposed by Salescast could be refined in order to take into account complex price breaks offered by suppliers.
The scenarios supported by Envision that can be made as complex as they need to be to really capture the specific complexity of your business. However, you don’t need to be a seasoned software developer to get started as we have designed Envision to be accessibe to anyone with decent Excel skills.
Want a specific analysis to be performed for your business? The Lokad staff can take care of that, just contact us.


