Out-of-shelf can explain 1/4 of store forecast error
The notion of forecasting accuracy is subtle, really subtle. It’s common sense to say that if the closer the forecasts from the future, the better, and yet common-sense can be plain wrong.
With the launch of Shelfcheck, our on-shelf availability optimizer, we have started to process a lot more data at the point of sales level, trying to automatically detect out-of-shelf (OOS) issues.Over the last few months, our knowledge about OOS pattern has significantly improved, and today this knowledge is being recycled into our core forecasting technology.
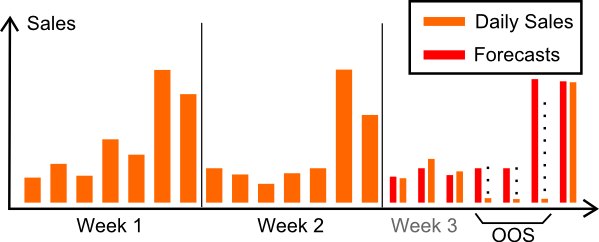
Let’s illustrate the situation. The graph below represents the daily aggregated sales at the store level for a given product. The store is open 7/7. A seven-day forecast is produced at the end of the week 2, but an OOS occurs in the middle of the week 3. Days marked with black dots have zero sales.

In this situation, the forecast is fairly accurate, but because of the OOS problem, the direct comparison of salesvs forecasts look like as if the forecast was significantly overforecasting the sales, which is not the case, at least not on the non-OOS days. The overforecast measurement is an artifact caused by the OOS itself.
So far, it seems that OOS can only degrade the perceived forecasting accuracy, which it does not seem too bad because presumably all forecasting methods should be equally impacted. After all, not forecasting model is able to anticipate the OOS problem.
Well, OOS can do a lot worse that just degrade the forecasting accuracy, OOS can also improve it.
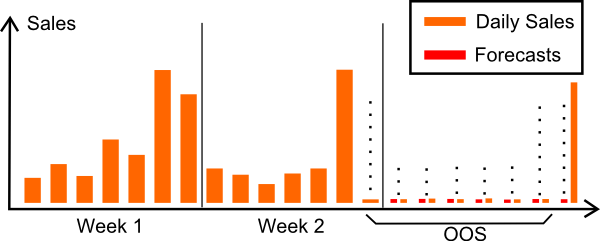
Let have a look at the graph to illustrate this. Again, we are looking at daily sales data, but this time the OOS problem starts on the very last day of week 2.

The forecast for the week 3 is zero the whole week. The forecasting model is anticipating the duration of the OOS. The forecast is not entirely accurate because on the last day of week 3, replenishment is made and sales are non-zero again.
Obviously, a forecasting model that anticipates the duration of the OOS issue is extremely accurate as far the numerical comparison sales vs forecasts is concerned. Yet, does it really make sense? No, obviously it does not. We want to forecast the demand not sales artifacts. Worse, a zero forecast can lead to a zero replenishment which, in turn, extend the actual duration of the OOS issue (and increase further the accuracy of our OOS-enthusiast forecasting model). This is obviously not a desirable situation, no matter how good the forecast happens to be from a naive numerical viewpoint.
Bad case of OOS overfitting
We have found that the situation illustrated by the 2nd graphic is far from being unusual. Indeed, with 8% on-shelf unavailability (a typical figure in retail) and a rough 30% MAPE on daily forecasts, OOS situations typically account for 8% x 100 / 30 ≈ 27% ≈ 1/4 of the total forecast error being measured. Indeed, by definition of MAPE, a non-zero forecast on zero-sale day (OOS) generates a 100% error.
Because the fraction of the error caused by OOS is significant, we have found that a simple heuristic such as “if last day has zero sales on a top seller product, then forecast zero sales for 7 days” may reduce the forecast error from a few percents by directly leveraging the OOS pattern. Obviously, very few practitioners would explicitly put such a rule among their forecasting models, but even a moderately complex linear autoregressive model may learn this pattern to a significant extend, and thus overfit OOS.
Naturally, Shelfcheck is here to help on those OOS matters. Stay tuned.
Reader Comments (2)
Hi Lars, Thanks for your follow-up. At the store level, things are really noisy. Think of 1 or 2 units sold per day per item as a typical case. Pricing is certainly important, but in practice, at the store level, it’s very hard to quantify precisely the impact of 5% price adjustment for a particular item. However, promotions (which is also a pricing effect, albeit a big one) do, indeed, have very measurable effects even at the store level. Then, Shelfcheck do integrate the daily pricing information. However, we did found out that in Food & Beverage, it’s very possible to significantly outperform (forecasting-wise) the accuracy of existing systems without leveraging the pricing information. However, I am not saying pricing info is useless, merely than you don’t need it to vastly improve very every single setup that we have observed so far in the retail industry. Then, in the future, pricing but also fine-grained loyalty data will become increasingly critical to stay competitive in the forecasting market.
Joannes Vermorel (6 years ago)
Hi, in F&B actual qty sold often has a strong correlation with actual sales price. This is often modelled using the Price Elasticity Index=qty change % / price change %. In my experience one dimensional statistical forecasting that only looks at actual qty sold without factoring in the actual average price becomes rather useless = a complete waste of time. Do you agree and what is your take on this ?
Lars (6 years ago)


