Business is UP but forecasts are DOWN
Statistical demand forecasting is a counter-intuitive science. This point was pressed a couple of times before, but let’s have a look at another misleading situation.
If every single product segment of my business is growing fast, then at least some products should have an upward sales trend as well. Right? Otherwise, we would not be growing at all.
This statement looks like just plain common sense; and yet it’s wrong, very wrong. We live in fast paced economy. Having an identical product being sold more than 3 years is the exception rather than the norm in most consumer good businesses. As a result, product life-cycles tend to dwarf organic growth of retailers.
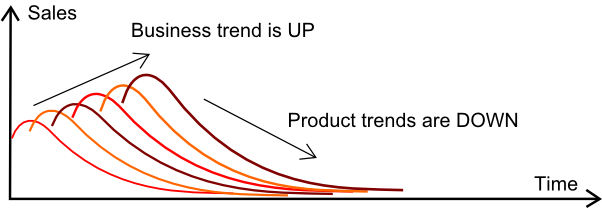
This situation is illustrated by the schema below.

This is a set of product sales plotted on the same graphic. Each curve is associated to a particular product; and products are launched over time. Each product come with its own lifecycle pattern. The lifecycle patterns here illustrate a typical novelty effect: sales quickly ramp-up after product launch, and then the product enters its downward phase, which ends when the product is finally phased out of the market.
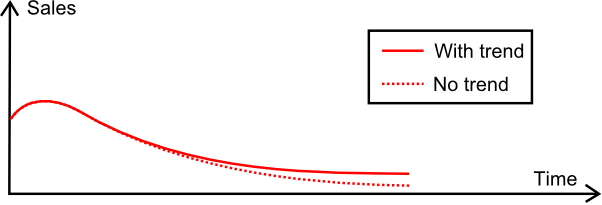
Yet, how does an upward trend - from the retailer itself - impacts this picture? Let’s have another look at the illustration below.

S****ales are higher with a positively trended retailer, yet this growth is nowhere strong enough to compensate for the product lifecycle effect. The sales of the product are still decreasing - albeit at a slower rate.
This situation outlines how we can have a fast-growing retail business with only negatively trended product sales. The main trick lies in the fact that new products keep being launched.
Alas, this situation generates a lot of confusion. Indeed, when sales forecasts severely mismatch overall expectations, it becomes very tempting to fix the forecasts.
Since most forecasting tools are poorly suited to deal with too varying or too intermittent demand anyway, it is tempting to aggregate sales per family, per category to produce an aggregated forecast; and then to de-aggregate forecasts at the SKU level using ratios. This approach is named top-down forecasting; and heavily used in many industries (textile among others).
Top-down forecasts produce results that look much closer to intuitive expectations: a growth is observed in the sales forecasts, and it matches growth observed on the various business segments.
Yet, by producing the forecast at the TOP level, the forecasting model is capturing an fictitious upward trend that only results from the contribution of regular product launches. If this fictitious ends up applied to a lower level - aka SKUs or products - then we significantly over-forecast the sales for each individual product.
Near worst case: massive overstock is generated for products precisely at the time they are phased out of the market.
From a forecasting perspective, a good forecasting system should be able to capture lifecycle effects. It means that sales forecasts may significantly differ from the overall business forecast. Business can go UP while every single product is getting DOWN. In such a situation, trying to fix forecasts is most like going to make them worse.
Addendum: Despite the date of this post (April 1st, 2011), this post is not a joke.


