Seasonality illustrated
Seasonality is one of the strongest statistical pattern that can be leveraged to refine forecasts. Below, 4 time-series aggregated at the weekly level (159 weeks). Historical data are in red and forecasts are in purple. Vertical gray markers indicate January 1st.
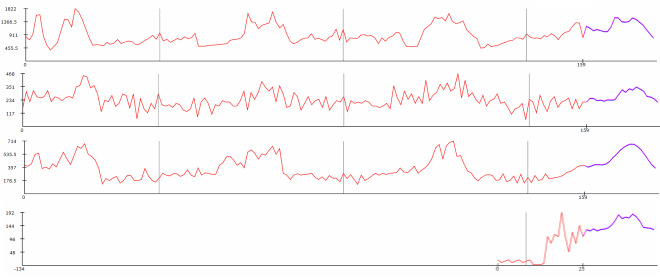
When illustrating seasonality, everyone (Lokad’s included) tend to use long time-series, much like the first three series here above. Indeed, it’s more visual and more appealing.
However, long time-series do not represent your usual situation. On average consumer goods have a lifespan of no more than 3 or 4 years. Thus, long time-series are typically a small minority in your dataset. Worse, those long time-series might be outliers, that do not reflect the behavior of other shorter-lived products.
Here above, the short 4th time-series is a much more representative case with less than 1 year of data. In such a situation, however, it’s much less clear how seasonality can be leveraged. The Lokad trick to do that consists of using multiple time-series analysis.
Learn more on our seasonality definition article.


