What's wrong with promotion forecasts?
It has been a little while since we posted some technical content about our forecasting methods. Let’s discuss further the case of promotion forecasts.
Promotion forecasts are especially interesting for two reasons:
- promotions represent a heavy part of the business for many companies.
- forecasts are likely to end up really wrong when ad-hoc methods are used.
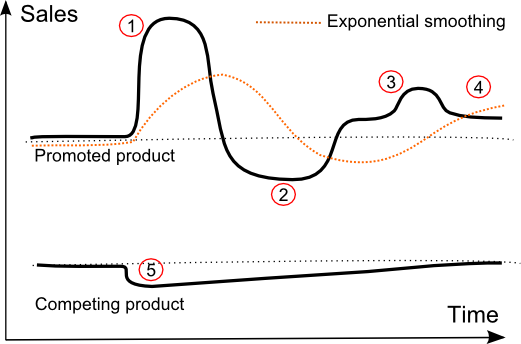
In order to clarify the traps looming behind promotion forecasts, let’s have a look at the following schema. The two black curves represent fictitious product sales - illustrating typical consumer response to a promotion.

Disclaimer: Those behaviors have been measured on Lokad databases. Yet, market responses vary a lot from one promotion to the next and from one business to the next. Our purpose here is not to provide accurate quantitative models, but rather to focus on what we believe to be key insights for promotion forecasts.
1. Primary promotion impact
The most important effect of a promotion is usually a large sales increase of the promoted product for the duration of the operation. This effect is illustrated with (1) in our schema.
Guessing that the sales are likely to increase is trivial, yet precisely estimating the impact of the promotion - that is to say the extra sales generated by the promotion itself - is a complicated process. Lokad is using its tags+events framework to do this.
It can be noted that classical forecasting methods such as exponential smoothing are completely missing promotional patterns.
2. Demand drop due to market saturation
The second effect of a promotion - which is too frequently overlooked - is the demand drop that comes just after the end of the promotion. See point (2) on the schema.
Indeed, by observing thousands of promotional operations, we have found that frequently, just after the end of a promotion, sales levels are dropping below the initial pre-promotion sales levels.
This drop reflects the temporary market saturation caused by the promotion itself. Basically, people who would have bought the product anyway have hurried their decision, resulting in fewer sales when the promotion stops.
When this drop is overlooked AND combined with a naive forecasting method, the combination can lead to extremely poor inventory management and overstocks. Indeed, the delayed behavior the exponential smoothing is likely to suggest inventory replenishments precisely when the demand is going to drop.
3. Mechanical echo due to customer synchronization
The third pattern comes from the synchronization effect of the promotion on customer replenishments. This point is illustrated with (3) on the schema.
All products (consumable or not) tend to have a lifecycle of their own. The promotion is synchronizing - to some extent - consumption patterns of customers. As a result, after the initial shock (the promotion itself), there is likely to be decreasing echos in customer demand.
In our measurement, it appears that most of the time only the first echo can be measured with enough confidence to be of any use for forecasting purposes. Subsequent echos do exist but they are too diffuse to be used to refine forecasts.
Again, if the demand bounce (3) happens right after the demand drop (2), then the exponential smoothing model is likely to cause frequent inventory shortage, because it completely fails to anticipate the bounce.
4. Demand drift due to market evolution
The fourth effect is the demand drift caused by the promotion. This effect is illustrated by point (4) in the schema.
A promotion acts as a market perturbation, and the base sales level is likely to be different after the promotion; hopefully higher, but our measures shows that the opposite, i.e. lower sales, also happens, yet with a lower frequency.
In our experience, establishing a quantitative forecast for the drift is really hard. Yet, the drift can be taken into account in order to speed-up forecasts adjustments after the end of the promotion.
5. Sales cannibalization
Sales cannibalization is typically the second major effect of a promotion in terms of absolute sales volumes. Cannibalized products end up with reduced sales during the promotion as illustrated by (5) on the schema.
Yet cannibalizations are harder to model, because the effect can be diffuse and potentially impact a wide range of unrelated products. Indeed, depending on the situation, some customers may have a fixed threshold for their spending. The immediate consequence of the threshold is that the opportunity spending offered by the promotion ends up compensated by restrictions on somewhat unrelated products.
Lokad is trying hard to provide fine grained promotion forecasts, taking into account all the effects that we can measure. If you decide to go for in-house forecasts (which we don’t recommend, but well), we suggest to make sure that neither (2) nor (5) gets overlooked.
Reader Comments (2)
Upsell, downsell and cross-sell are other factors that impact demand. They can be accounted for as well, but it’s whole different topic than promotions, and unfortunately, a bit too complex to be addressed in a comment. We will get back to this question at some point. Stay tuned. 7 years ago | Joannes Vermorel
Hi excellent article, but how about upsells and downsells? How would work it in this schema? 7 years ago | Jose

