Understanding varying lead time
Recently, quite a few questions have been raised about varying lead times, and how it impacts safety stock calculations. Indeed, Salescast associates a static lead time to each SKU.
It’s clear though that lead times aren’t deterministic and that there is some uncertainties involved when a reorder is send to a supplier. Thus, we have been - rightfully - asked for a safety stock formula taking into account the lead time uncertainty as well as the future demand uncertainty.
Yet, before jumping straight into the equations, every quantitative business analysis must start with some data at hand to better understand what’s going on. Fortunately, Anthony Holloway (from k9cuisine, Dog Food & Dog Treats) was kind enough to hand us over a small dataset representing a series of observed lead times.

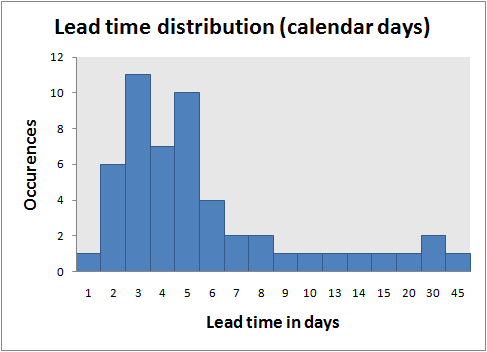
As expected, lead times are varying. Yet, it can already be noted that it’s clearly not a normal distribution (it’s way too asymmetric for that). Thus, the uncertainty behind the demand forecast and the uncertainty behind the lead time cannot be handled with a symmetric formula.
Our experience at Lokad is telling us that - on average - there is not so much variations in lead time due to shipping and transport. Those two operations tend to be fairly deterministic.
Usually, the root cause of lead time variation is supplier-side shortage. Yet, with the graph here above, the shortage pattern isn’t that obvious.
Yet, we started thinking more about this graph, we noticed a suspicious pattern: the 2 lead time peaks are at respectively 3 and 5 days. This looks an awful lot like a week-end effect to us. In other words, shipping & transport take usually 3 working days that is to say 3 or 5 calendar days depending on an eventual week-end.
Discussing more with the retailer who had produced the dataset, we got the confirmation that, indeed, lead times were expressed as plain calendar days.

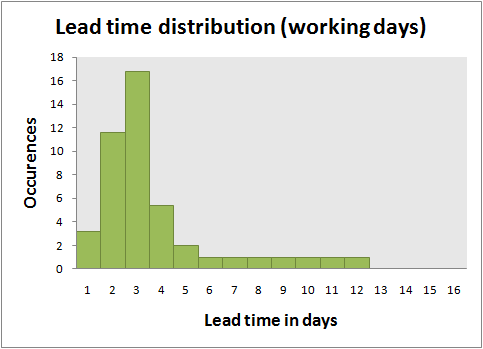
Thus, we decided to apply a working days correction to this graph. The green graph here above displays the very same lead time distribution as the previous blue one, but lead times are now expressed as working days instead.
With the new corrected graph, a much sharper pattern emerges. We have a clear two phases process:
- the supplier has the product available at hand, in which case, lead times takes 3 days on average, with a minor +1/-1 variation.
- the supplier does not have the product at hand, in which case. lead times takes a random amount of time, with a rather flat distribution reflecting the supplier-side (longer) lead time.
Furthermore, we can even easily evaluate the supplier-side service level, that is to say the probability for the supplier not hitting a shortage when a reorder is made. In the present case, if we consider 5 days as being the shortage indicator threshold, then we end up with a service level at 75% which is within the usual range for retail wholesalers.
A key question remains: how should we adjust the Salescast settings to take into account varying lead times? The question will be addressed in the next post. Stay tuned.
Reader Comments (2)
Just wondering how to calculate safety stock on components. For instance, in poultry business, we would need ingredients (sauce, actobine) and packaging (cartons especially). Some of the cartons have a lead time of about 45 working days. As a result the longest lead time for a given finished poultry product would be 45 days and hence, we have to have at least 45 days of finished product in safety stock. 6 years ago | Mayuresh
Maybe I have fuzzy math, but it seems to me that there would be 30 working days in 45 calendar days, not 12. Am I missing something? 6 years ago | Russ D


