Forecast Value Added
Forecast value added1 (FVA) is a simple tool for evaluating the performance of each step (and contributor) in the demand forecasting process. Its ultimate goal is to eliminate waste in the forecasting process by removing the human touchpoints (overrides) that do not increase forecast accuracy. FVA is predicated on the notion that greater forecasting accuracy is worth pursuing and that identifying the overrides that increase it, and eliminating those that do not, is desirable. Despite positive intentions, FVA demonstrates limited once-off utility, and if deployed on an ongoing basis, presents a multitude of drawbacks including faulty mathematical assumptions, misconceptions about the intrinsic value of increased forecasting accuracy, and the absence of a robust financial perspective.

Overview of forecast value added
Forecast value added aims to eliminate waste and increase demand forecasting accuracy by encouraging - and evaluating - inputs from multiple departments (including non-demand-planning teams, such as Sales, Marketing, Finance, Operations, etc.). By evaluating the value of each human touchpoint in the forecast process, FVA provides companies actionable data on the overrides that make the forecast worse, thus providing them an opportunity to identify and eliminate efforts and resources that do not contribute to better forecasting accuracy.
Michael Gilliland, whose The Business Forecasting Deal brought mainstream attention to the practice, argues2
“FVA helps ensure that any resources invested in the forecasting process - from computer hardware and software to the time and energy of analysts and management - are making the forecast better. If these resources are not helping to forecast, they can be safely redirected to more worthwhile activities".
One identifies which activities and resources are helping through a multi-stage forecasting process where a statistical forecast is generated using the company’s extant forecasting software. This statistical forecast is then subjected to manual changes (overrides) by each selected department. This adjusted forecast is then compared with a naive, benchmark forecast (without changes, acting as a placebo) and the real, observed demand.
If the changes made by departments made the statistical forecast more accurate (compared to the untouched statistical forecast), they contributed positive value. If they made it less accurate, they contributed negative value. Similarly, if the statistical forecast was more accurate than the placebo, it added positive value (and opposite if it was less accurate).
FVA is, thus, “[a measure of] the change in a forecasting performance metric that can be attributed to a particular step or participant in the forecasting process”2.
Supporters of forecast value added argue that it is an essential tool in modern supply chain management. By identifying which parts of the forecasting process are beneficial and which are not, organizations can optimize their forecast accuracy. The overarching rationale is improved forecasting leads to better inventory management, smoother production planning, and more efficient resource allocation.
This, consequently, should reduce costs, minimize stockouts, and reduce overstocks, all while increasing customer satisfaction and generating a more inclusive forecasting and corporate ethos. The process has proved remarkably popular, with FVA being applied at several notable companies in exceptionally competitive industries, including Intel, Yokohama Tire, and Nestle3.
Performing a forecast value added analysis
Performing a forecast value added analysis involves several intuitive steps, typically a close version of the following:
-
Define the process by identifying the individual steps or components, i.e., the list of departments that will be consulted, the order of consultation, and the specific parameters each contributor will use to modify the initial forecast.
-
Generate a benchmark forecast. This benchmark typically takes the form of a naive forecast. A statistical forecast is also generated, as per the normal forecasting process within the company, using the same dataset utilized in the generation of the benchmark. This statistical forecast serves as the foundation for all subsequent adjustments
-
Collect insights from the designated contributors, adhering to the exact parameters defined in the first step. This might include market trend insights, promotional plans, operational constraints, etc.
-
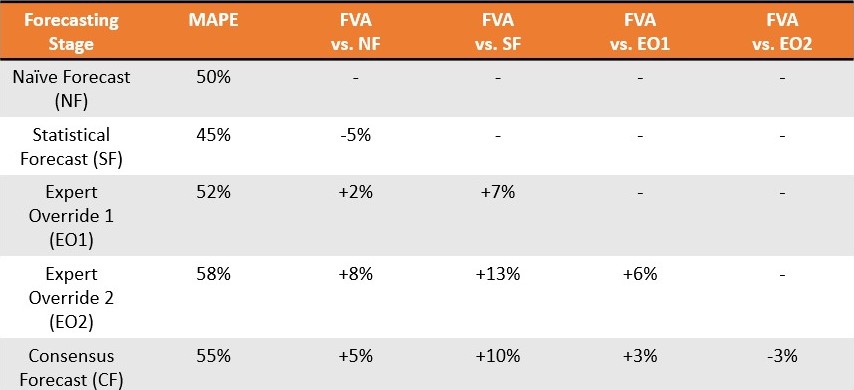
Calculate the FVA for each contributor by comparing the accuracy of the statistical forecast before and after that contributor’s input. In turn, the accuracy of the statistical forecast is contrasted with that of the simple benchmark forecast. Contributions that enhance forecast accuracy receive positive FVA, while those that diminish accuracy receive negative FVA.
-
Optimize by improving or eliminating contributions with negative FVA, while preserving or enhancing those with positive FVA.
These steps form an ongoing process that is iteratively improved in pursuit of greater forecast accuracy. The FVA process, and how it differs from a traditional forecasting one, is illustrated below.
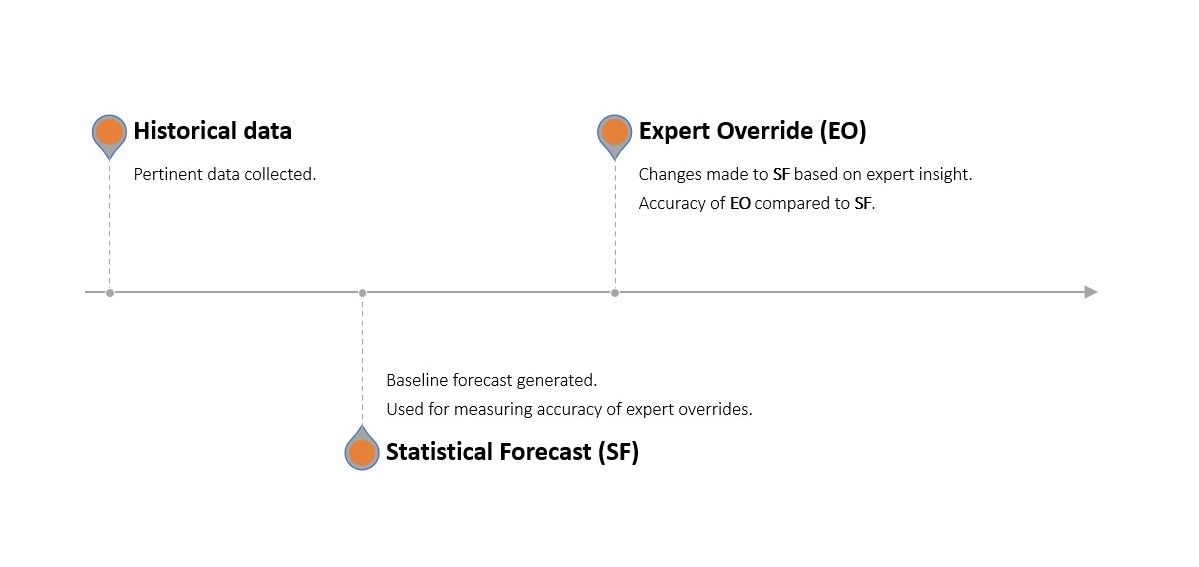
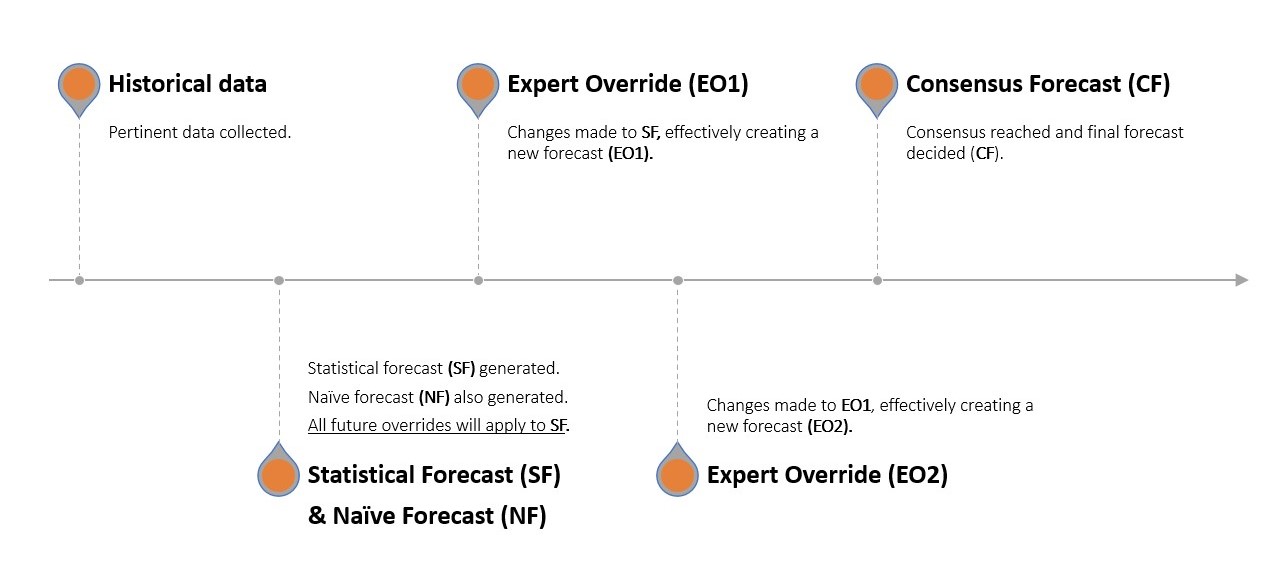
Consider an apple seller. Paul (Demand Planning) informs management that the company sold 8 apples in each of the last 3 months. The naïve forecast says the company will sell 8 again next month, but Paul has an advanced statistical software that predicts 10 apples will be sold (statistical forecast). John (Marketing) chimes in and says he intends on releasing a snazzy new slogan this month6 and sales are likely to be higher this month on the strength of his rapier wit. George (Sales) intends to bundle apples together and lower prices slightly, stimulating sales even further and increasing demand. Richard (Operations) is initially stumped but then revises the forecasted demand to reflect an upcoming downtime in crucial apple-sorting machinery that he believes will adversely impact the company’s ability to meet demand. The statistical forecast has, thus, been manually tweaked three times. The departments next congregate to verbally reach a consensus forecast.
One month later, the company performs a backtest to confirm how great the delta7 was at each step of this forecasting relay - i.e., how “off” each department’s contribution was. This is not difficult as they now possess the actual sales data for the previous month and Paul can isolate, beat by beat, how much error was introduced by John, George, and Richard, respectively, as well as the consensus forecast stage8.
The mathematical perspective on forecast value added
Under the hood, forecast value added is a remarkably straightforward and deliberately uncomplicated process. Contrary to forecasting processes that demand an advanced knowledge of mathematics and statistical reasoning, FVA “is a common-sense approach that is easy to understand. It expresses the results of doing something versus having done nothing”3.
Expressing the results of having done something versus nothing, however, still requires mathematical intervention, and this typically takes the form of a simple time series - the backbone of traditional forecasting methods. The primary goal of time-series analysis is conveniently and intuitively representing future demand as a single, actionable value. In the context of FVA, the baseline time series serves as a placebo or control, against which all the analyst overrides (detailed in the previous section) are compared. A baseline time series can be generated through various methods, commonly including various forms of naive forecasting. These are commonly evaluated using metrics such as MAPE, MAD, and MFE.
Choosing a benchmark forecast
The choice of baseline forecast will vary depending on the goals or constraints of the company in question.
-
Naive Forecast and Seasonal Naive Forecasts are often chosen for their simplicity. They are easy to calculate and understand as they are predicated on the assumption that previous data will be repeated in the future. They provide a sensible baseline in many contexts, especially when the data is reasonably steady or appears to demonstrate a clear pattern (trend, seasonality, etc.).
-
Random Walk and Seasonal Random Walk are typically used when the data demonstrates significant randomness or variability, or when there appears to be a strong seasonal pattern that is also subject to random fluctuations. These models add an element of unpredictability to the naive forecast concept, in an attempt to reflect the inherent uncertainty of forecasting future demand.
Evaluating forecast value added results
-
MFE (Mean Forecast Error) can be used to assess whether a forecast tends to overestimate or underestimate actual results. This could be a useful metric in a situation where it is more costly to over-forecast than to under-forecast, or vice versa.
-
MAD (Mean Absolute Deviation) and MAPE (Mean Absolute Percentage Error) provide measures of forecast accuracy that consider both over- and under-forecasting demand. They might be used as gauges of accuracy when it is important to minimize the overall size of forecast errors, regardless of whether they result in over- or under-forecasting.
Though MAPE is commonly featured in FVA-related sources, consensus varies as to which forecast-metric configuration to utilize in an FVA analysis2 4 9.
Limitations to FVA
Forecast value added, despite its inclusive approach, noble goals, and low barrier for entry, is arguably subject to an extensive array of limitations and false premises. These deficiencies span a wide range of fields, including mathematics, modern forecasting theory, and economics.
Forecasting is not collaborative
Forecast value added is predicated on the notion that collaborative forecasting is good, in the sense that multiple (and even consensus) human overrides can add positive value. FVA further believes that this positive forecast value is distributed throughout the company, as employees of different departments can all possess valuable insights into future market demand.
Hence, the problem as FVA sees it is that this collaborative approach comes with pesky inefficiencies, such as some human touchpoints contributing negative value. FVA thus seeks to sift through the wasteful forecasting collaborators in search of the good ones.
Unfortunately, the idea that forecasting is better as a collaborative, multi-departmental process is contrary to what modern statistical forecasting demonstrates - including in retail situations.
An extensive review of the fifth Makridakis forecasting competition10 demonstrated that “all 50 top-performing methods were based on ML (machine learning). Therefore, M5 is the first M-competition in which all of the top-performing methods were both ML methods and better than all of the other statistical benchmarks and their combinations” (Makridakis et al., 2022)11. The M5 accuracy competition was based on forecasting sales using historical data for the largest retail company in the world by revenue (Walmart).
In fact, according to Makridakis et al. (2022), “the winning model [in the M5] was developed by a student with little forecasting knowledge and little experience in building sales forecasting models”11, thus casting doubt on how vital the market insights of disparate departments truly are in a forecasting context.
This is not to claim that more complex forecasting models are inherently desirable. Rather, sophisticated models often trump simplistic ones, and FVA’s collaborative forecasting is a simplistic approach to a complex problem.
Ignores future uncertainty
FVA, like many tools and techniques surrounding forecasting, presumes that knowledge of the future (in this case, demand) can be represented in the form of a time series. It uses a naive forecast as a benchmark (typically a cut-and-paste copy of previous sales) and has collaborators manually round up or down the values on a statistical forecast. This is flawed for two reasons.
First of all, the future, be that in general or forecasting terms, is irreducibly uncertain. As such, expressing it as single value is an inherently misguided approach (even if augmented with a safety stock formula). Presented with the irreducible uncertainty of the future, the most sensible approach is determining a range of likely future values, evaluated with respect to each one’s potential financial return. This trumps, from a risk management perspective, attempting to identify a single value as per a traditional time series - something that entirely ignores the problem of future uncertainty.
Secondly, the insights (however useful they may seem) of collaborators are typically of the kind not easily (if at all) translated to a time-series forecast. Consider a situation in which a company knows ahead of time that a rival is about to enter the market. Alternatively, imagine a world in which competitive knowledge indicates that one’s fiercest competitor is planning to release an impressive new line of summer clothes. The proposition that these kinds of insights can be collaboratively folded by non-specialists into a single value expressed in a time series is fanciful.
In reality, any similarities to actual future sales (positive value added) will be completely accidental, in the sense that human overrides (be they rounding demand up or down) are equal expressions of the same faulty input. A person who contributes negative value is thus no more “right” or “wrong” - from a logical perspective - than the person who contributes positive value.
At its core, FVA tries to thrust three-dimensional properties (human insights) onto a two-dimensional surface (a time series). It may look right from a certain angle, but that does not mean it is right. This gives FVA a rather misleading appearance of statistical rigour.
Even if the company uses a traditional forecasting process with minimal human touchpoints (as per Figure 1), if the underlying statistical forecast being analyzed by FVA is a time series, the analysis itself is an exercise in waste.
Ironically wasteful
As a once-off demonstration of overconfidence and biased decision-making, FVA has utility. Nobel prizes have been awarded on the depth, breadth, and endurance of cognitive biases in human decision-making12 13, yet it is entirely conceivable some teams fail to accept just how faulty human override typically is until they are emphatically shown.
However, as an ongoing management tool, FVA is inherently flawed and arguably contradictory. If one’s statistical forecasts are outperformed by a naive forecast and collaborative tinkering, one should really consider the following question:
Why are the statistical models failing?
FVA, unfortunately, has no answer for this because it fundamentally is not designed to. It does not yield insights into why statistical models might under-perform, simply that they under-perform. FVA is thus not so much a diagnostic tool as a magnifying glass.
While a magnifying glass can be useful, it does not provide actionable insights into what the underlying problems with the statistical forecasting software actually are. Understanding why one’s statistical forecasts under-perform has far greater direct and indirect value, and is something FVA does not bring into sharper focus.
Not only does FVA software not yield this important insight, it formalizes waste in other ways. Gilliland (2010) presents a theoretical situation in which a consensus forecast is outperformed in 11 out of 13 weeks (85% fail rate), averaging 13.8 percentage points of error. Rather than warranting immediate discontinuation, the advice is to
“bring these findings to your management and try to understand why the consensus process is having this effect. You can start to investigate the dynamics of the consensus meeting and the political agendas of the participants. Ultimately, management must decide whether the consensus process can be fixed to improve the accuracy of the forecast, or whether it should be eliminated.”2
In this scenario, not only does the FVA software not diagnose the underlying problem of statistical forecast performance, but the layer of FVA instrumentation merely increases bureaucracy and resource allocation by dissecting activities that manifestly do not contribute value.
As such, installing a layer of FVA software ensures that one continues to get similar low-resolution images of an ongoing problem and directs valuable resources to understanding faulty inputs that could have been ignored right from the outset.
This, arguably, is not the most prudent allocation of company resources that have alternative uses.
Overestimates the value of accuracy
At its core, FVA presumes that increased forecast accuracy is worth pursuing in isolation, and proceeds on this basis as if this were self-evidently true. The notion that increased forecast accuracy is desirable is an understandably appealing one, but it - from a business perspective - presumes that greater accuracy translates into greater profitability. This is patently not the case.
This is not to claim that an accurate forecast is not worth having. Rather, an accurate forecast should be tightly tethered to a purely financial perspective. A forecast might be 40% more accurate but the associated cost means the company makes 75% less profit overall. The forecast, though appreciably more accurate (positive value added), has not reduced dollars of error. This violates what is the core tenet of business: make more money, or at least do not waste it.
In terms of FVA, it is entirely conceivable that the positive value added by one department is a net loss to a company, whereas the negative value added by another is imperceptible. While Gilliland does acknowledge that some activities might increase accuracy without adding financial worth, this angle is not followed to its logical endpoint: a purely financial perspective. Gilliland uses the example of an analyst increasing forecast accuracy by a single percentage point:
“The mere fact that a process activity has positive FVA does not necessarily mean it should be kept in the process. We need to compare the overall benefits of the improvement to the cost of that activity. Is the extra accuracy increasing revenue, reducing costs, or making customers happier? In this example, the analyst override did reduce error by one percentage point. But having to hire an analyst to review every forecast can be expensive, and if the improvement is only one percentage point, is it really worth it?”2
In other words, a 1% increase might not be worth pursuing, but a greater increase in forecast accuracy could be. This presumes that financial value is tied to greater forecast accuracy, which is not necessarily true.
Thus, there is an ineluctable financial dimension to forecasting that is at best understated in FVA (and, at worst, barely noticed). This purely financial perspective really ought to be the foundation upon which a tool aimed at reducing waste is built.
Vulnerable to manipulation
FVA also presents an obvious opportunity for gaming and forecast manipulation, especially if forecast accuracy is used as a measure of departmental performance. This is the spirit of Goodhart’s Law, which states that once an indicator becomes the chief measure of success (accidentally or deliberately), that indicator ceases to be useful. This phenomenon can often open the door to misinterpretation and/or manipulation.
Suppose the sales team is tasked with making short-term adjustments to the demand forecast based on their interactions with customers. The sales department might view this as an opportunity to signal their value and start making changes to the forecast even when not necessary, in an attempt to demonstrate a positive FVA. They might overstate demand, making them appear to be generating value, or recalculate demand downward, making them appear to be correcting an overly sanguine projection from a previous department. Either way, the Sales department may appear more valuable to the company. As a result, the marketing department might then feel pressured to appear to be generating value, too, and the team starts making similarly arbitrary tweaks to the forecast (and so on and so forth).
In this scenario, the FVA measure, originally intended to improve forecast accuracy, becomes merely a political mechanism for departments to signal value rather than adding any, a criticism even FVA advocates acknowledge9. These examples demonstrate the potential dangers of Goodhart’s Law when it comes to FVA14.
Supporters of FVA might argue these psychological criticisms are the entire point of FVA, namely the identification of valuable versus junk inputs. However, given the biases associated with human override in forecasting are so well-understood nowadays, the resources spent dissecting these bias-laden inputs would be better allocated to a process that avoids (as much as possible) said inputs in the first place.
Local Ssolution to a systemic problem
Implicitly, the attempt to optimize demand forecasting in isolation presupposes that the problem of demand forecasting is separate to other supply chain problems. In reality, demand forecasting is complex due to the interaction of a wide array of systemic supply chain causes, including the influence of varying supplier lead times, unexpected supply chain disruptions, stock allocation choices, pricing strategies, etc.
Attempting to optimize demand forecasting in isolation (aka, local optimization) is a misguided approach given the system-level problems - the true root causes - are not properly understood and addressed.
Supply chain problems - of which demand forecasting is certainly one - are like people standing on a trampoline: moving one person produces disequilibrium for everyone else15. For this reason, holistic, end-to-end optimization is better than attempting to cure symptoms in isolation.
Lokad’s take
Forecast value added takes a bad idea (collaborative forecasting) and makes it sophisticated, dressing the bad idea in layers of unnecessary software and squandering resources that have better, alternative uses.
A more sophisticated strategy would be to look beyond the entire concept of forecasting accuracy and opt instead for a risk management policy that reduces dollars of error. In conjunction with a probabilistic forecasting approach, this mindset moves away from arbitrary KPIs - such as increasing forecasting accuracy - and factors the totality of one’s economic drivers, constraints, and potential supply chain shocks into one’s inventory decision-making. These kinds of risk (and waste) vectors cannot be effectively quantified (and eliminated) by a tool that leverages a collaborative, time-series perspective, such as that found in forecast value added.
Furthermore, by separating demand forecasting from overall supply chain optimization, FVA (perhaps unintentionally) augments the accidental complexity of the demand forecasting process. Accidental complexity is synthetic and results from the gradual accretion of unnecessary noise - usually human-sourced - in a process. Adding redundant stages and software to the forecasting process, as FVA does, is a prime example of accidental complexity and can make the problem at hand significantly more complex.
Demand forecasting is an intentionally complex problem, which is to say it is an inherently puzzling and resource-intensive task. This complexity is an immutable trait of the problem and represents a much more troubling class of challenge than accidentally complex issues. For this reason, it is best to avoid attempts at solutions that oversimplify and fundamentally misconstrue the problem at hand16. To echo the medical rhetoric of FVA literature, this is the difference between curing an underlying illness and constantly treating symptoms as they arise17.
In short, FVA exists in the space between cutting-edge supply chain theory and the public’s awareness of it. Greater education in the underlying causes of demand uncertainty - and its roots in the evolving supply chain discipline - is recommended.
Notes
-
Forecast Value Added and Forecast Value Add are used to refer to the same forecasting analysis tool. Though both terms are widely used, there is a negligible preference in North America for the latter (according to Google Trends). However, Michael Gilliland explicitly referred to it as Forecast Value Added throughout The Business Forecasting Deal - the book (and author) most commonly cited in discussions on FVA. ↩︎
-
Gilliland, M. (2010). The Business Forecasting Deal, Wiley. ↩︎ ↩︎ ↩︎ ↩︎ ↩︎ ↩︎ ↩︎
-
Gilliland, M. (2015). Forecast Value Added Analysis: Step by Step, SAS. ↩︎ ↩︎ ↩︎
-
Chybalski, F. (2017). Forecast value added (FVA) analysis as a means to improve the efficiency of a forecasting process, Operations Research and Decisions. ↩︎ ↩︎
-
Model table was adapted from Schubert, S., & Rickard, R. (2011). Using forecast value added analysis for data-driven forecasting improvement. IBF Best Practices Conference. The stairstep report also appears in Gilliland’s The Business Deal. ↩︎
-
John opted for “All you need is apples” ahead of the slightly more verbose “We can work it out…with apples”. ↩︎
-
In the present context, delta is a measurement of how much error was introduced to the forecast by each member of the forecasting process. This usage of the term differs slightly from delta in options trading, which measures the rate of change in an option’s price relative to the price of an underlying asset. Both are overall expressions of volatility, but the devil is in the details. ↩︎
-
The reader is invited to replace forecasting apple demand with forecasting demand for a large, global network of stores, both online and offline, all of which possess a catalog with 50,000 SKUs. The difficulty, unsurprisingly, increases exponentially. ↩︎
-
The Spyros Makridakis forecasting competitions, known colloquially as the M-competitions, have run since 1982 and are considered the foremost authority on cutting- (and occasionally bleeding-) edge forecasting methodologies. ↩︎
-
Makridakis, S., Spiliotis, E., & Assimakopolos, V., (2022). M5 Accuracy Competition: Results, Findings, and Conclusions. It is worth mentioning that not all 50 top-performing methods were ML-based. There was one notable exception… Lokad. ↩︎ ↩︎
-
The work (both individually and collectively) of Daniel Kahneman, Amos Tversky, and Paul Slovic represents a rare example of landmark scientific research achieving mainstream acclaim. Kahneman’s 2011 Thinking, Fast and Slow - which details much of his 2002 Nobel-prize-winning research - is a touchstone text in popular science writing and covers biases in decision-making to a degree beyond the scope of this article. ↩︎
-
Karelse, J. (2022), Histories of the Future, Forbes Books. Karelse dedicates an entire chapter to the discussion of cognitive biases in a forecasting context. ↩︎
-
This is a nontrivial point. Departments typically have KPIs they must hit, and the temptation to gerrymander forecasts to serve their own needs is both understandable and foreseeable (pun intended). For context, Vandeput (2021, previously cited) observes that senior management - the final stop on the FVA carousel - may consciously skew the forecast to please shareholders and/or board members. ↩︎
-
This analogy is lifted from psychologist Carol Gilligan. Gilligan originally used it in the context of children’s moral development and the interrelation of human action. ↩︎
-
It is worth planting a flag here. Solution(s) is something of a misnomer in the context of intentional complexity. Tradeoff(s) - available in better or worse flavors - would better reflect the delicate balancing act associated with addressing intentionally complex problems. One cannot really solve a problem where two or more values are in complete opposition. An example is the struggle between reducing costs and achieving higher service levels. Given the future is irreducibly uncertain, there is no way to predict demand with 100% accuracy. One can, however, accomplish 100% service level - if that is one’s key business concern - simply by stocking far more inventory than one could ever possibly sell. This would result in enormous losses, thus companies, implicitly or otherwise, accept there is an unavoidable tradeoff between resources and service level. As such, the term “solution” improperly frames the problem as one that is capable of being solved rather than attenuated. See Thomas Sowell’s Basic Economics for an in-depth analysis of the tug-of-war between rivalling tradeoffs. ↩︎
-
In The Business Forecasting Deal, Gilliland likens FVA to a drug trial with naïve forecasts acting as the placebo. ↩︎